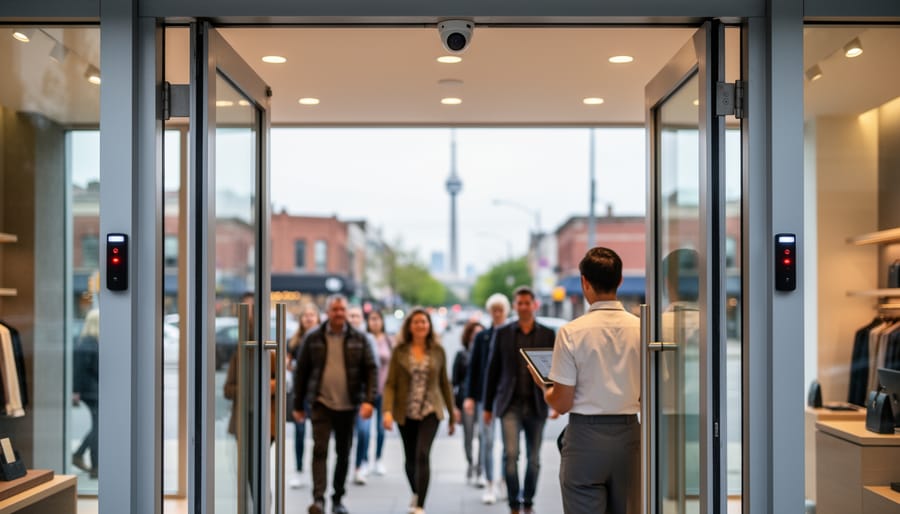
Track customer visits using sensors installed at your store entrance—infrared beams, WiFi detection, or video analytics from providers like ariadne.inc deliver real-time counts showing exactly when shoppers enter your space. Compare your Monday morning traffic against Saturday afternoon peaks to schedule staff precisely where they’re needed, cutting labor costs by up to 30% while maintaining service quality during rush periods.
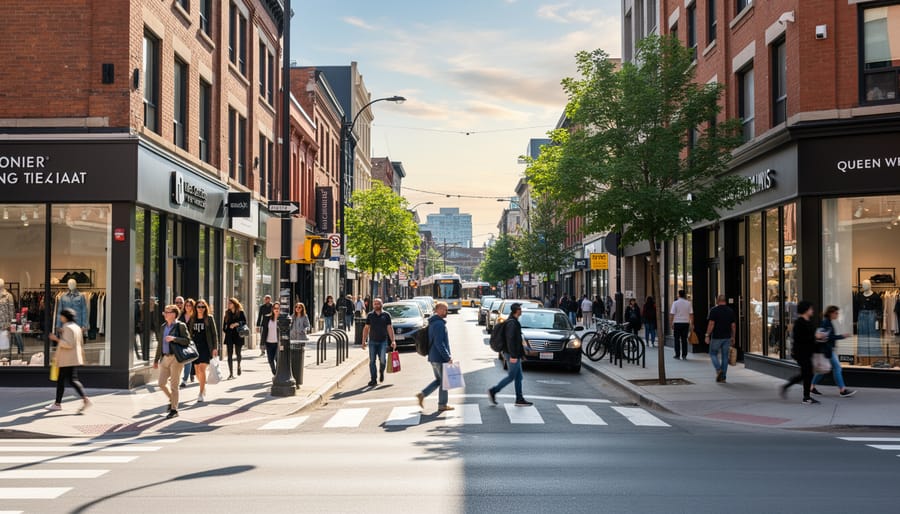
Measure conversion rates by dividing daily transactions by total visitors, revealing whether your window displays and merchandising actually turn browsers into buyers across Toronto’s retail corridors. A Queen West boutique discovered their 8% conversion rate jumped to 14% after repositioning their entrance display based on traffic pattern data showing most visitors turned left upon entry.
Benchmark your performance against neighboring stores and Toronto retail averages—knowing that Yorkville luxury retailers typically see 200-400 daily visitors while Distillery District shops average 150-250 helps you set realistic growth targets. Foot traffic analytics aren’t just numbers on a dashboard; they’re your roadmap to understanding customer behavior in Toronto’s competitive retail landscape, where rent costs demand every square foot performs optimally.
The technology has become remarkably affordable, with basic systems starting around 150 dollars monthly, making data-driven decisions accessible whether you operate a single storefront or manage multiple locations across the GTA.
What Foot Traffic Analytics Really Means for Toronto Shops
The Basics: Counting More Than Just Bodies
Gone are the days when foot traffic simply meant counting heads walking through your door. Today’s analytics platforms offer Toronto retailers a comprehensive picture of customer behavior that would make old-fashioned clicker counters look positively prehistoric.
Modern footfall technology tracks how long shoppers linger in specific areas of your store, revealing which displays capture attention and which ones customers breeze past. It measures conversion rates by comparing visitors to actual purchases, helping you understand if your Queen Street storefront is attracting browsers or buyers. Peak hour tracking shows exactly when your Yorkville boutique gets slammed versus when it’s quiet enough to restock shelves.
Perhaps most valuable are the traffic pattern insights. These systems map customer journeys through your space, showing whether people naturally gravitate toward your windows or back displays. For Toronto retailers competing in mixed-use neighborhoods where pedestrians might duck in to escape winter cold or summer heat, distinguishing genuine shoppers from weather refugees becomes crucial data.
This granular information transforms foot traffic from a vanity metric into actionable intelligence. You’re not just learning how many people visited—you’re understanding how they behave once inside.
Why Toronto’s Unique Retail Scene Needs Different Data
Toronto isn’t your average retail market, and tracking foot traffic here requires understanding what makes this city tick. Start with the weather – those brutal winters and steamy summers dramatically shift shopping patterns. While suburban malls thrive during February blizzards, downtown retailers might see a dip unless they’re connected to something special.
That something special? The PATH system. This underground network spans 30 kilometers and connects dozens of retail spaces, meaning traditional street-level counting misses a massive chunk of the story. A shop might seem quiet at ground level while PATH entrances buzz with activity below.
Then there’s the incredible diversity of Toronto’s diverse neighborhoods. Kensington Market operates differently than Yorkville, which functions nothing like the Distillery District. Each area attracts different crowds at different times, influenced by cultural events, transit access, and local character. Cookie-cutter analytics simply don’t cut it here – you need data solutions that account for underground passages, seasonal extremes, and the distinct personality of each neighborhood to truly understand where your customers are coming from and when they’re most likely to visit.
The Technology Behind the Numbers
Sensors, Cameras, and WiFi Tracking
Toronto retailers rely on three primary technologies to understand how shoppers move through their spaces, each with distinct advantages and privacy implications worth considering.
Infrared sensors, the most traditional approach, count people passing through doorways by detecting body heat. Think of them as invisible gatekeepers at store entrances. They’re remarkably accurate for basic counting—typically 95-98%—and completely anonymous since they can’t identify individuals. You’ll find these at many Queen Street West boutiques and Yorkville retailers where simple entry-exit counts provide valuable insights without raising privacy concerns.
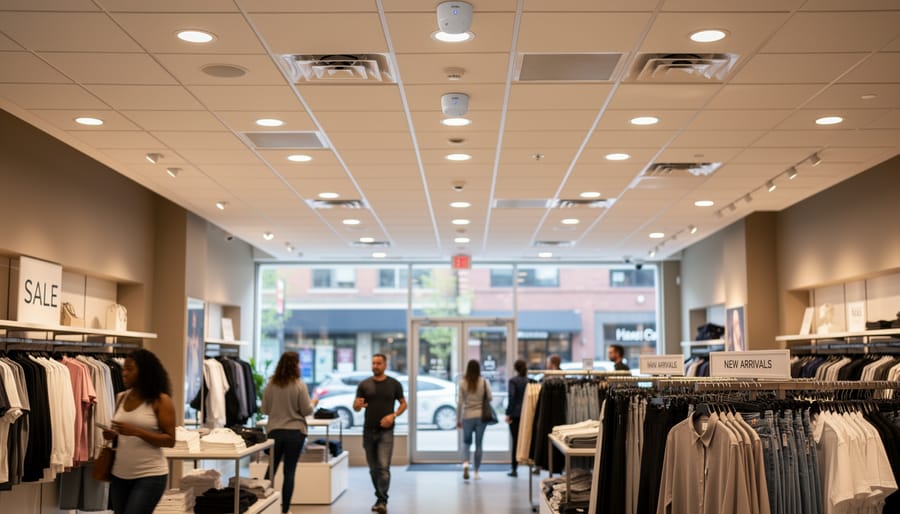
Camera-based systems take things further, using computer vision to track movement patterns throughout stores. They can tell retailers which displays draw attention at the Eaton Centre or how long shoppers linger in different sections. Modern systems anonymize data immediately, creating heat maps rather than storing identifiable images. Accuracy hovers around 90-95%, though they can struggle during busy periods like Boxing Day sales.
WiFi tracking detects smartphones as they move through retail spaces, measuring dwell time and repeat visits. This technology sparked privacy debates in Toronto back when it first appeared, but current systems use encrypted, anonymized MAC addresses rather than personal information. Retailers must post clear signage about WiFi tracking—something you’ve probably noticed at larger shopping destinations like CF Toronto Eaton Centre.
The good news for privacy-conscious Torontonians? These technologies focus on patterns and trends, not individual identification, helping local businesses serve you better while respecting your anonymity.
What These Systems Actually Cost
Let’s talk numbers, because you’re probably wondering what this technology will actually set you back. If you’re running an independent boutique along Queen West or a café in Leslieville, basic entry-level systems start around $200 to $500 for simple door counters that give you daily traffic totals. These no-frills options work well for small spaces where you just need baseline data.
Mid-range solutions, which include analytics dashboards and comparison features, typically run between $1,000 and $3,000 upfront, plus monthly software fees of $50 to $200. These are popular with multi-location operators managing a few Toronto stores who want deeper insights without breaking the bank.
For retail chains and shopping centres like those dotting Yonge Street or the Eaton Centre, enterprise systems with heat mapping, dwell time analysis, and integration capabilities can cost $5,000 to $15,000 per location, with ongoing service agreements adding another $200 to $500 monthly. The pricing often depends on store size, number of entry points, and how detailed you want your analytics.
Many Toronto providers offer flexible pricing models, including subscription-based options that reduce upfront costs. The key is matching your investment to your actual needs rather than over-buying features you won’t use.
Real Results from Toronto’s Retail Corridors
Yorkville’s Luxury Retailers
The Yorkville shopping district has mastered the art of using foot traffic analytics to create exceptional shopping experiences. High-end retailers like Holt Renfrew and boutique luxury shops track customer flow patterns to determine optimal staffing levels during peak hours, ensuring their discerning clientele receives white-glove service without waiting.
These analytics reveal fascinating insights about their affluent shoppers. Data shows that Wednesday afternoons and Saturday mornings draw the highest foot traffic, allowing managers to schedule their most experienced sales associates accordingly. Window displays get refreshed based on which storefronts generate the most pauses and entries—a metric that’s revolutionized how luxury brands showcase their collections.
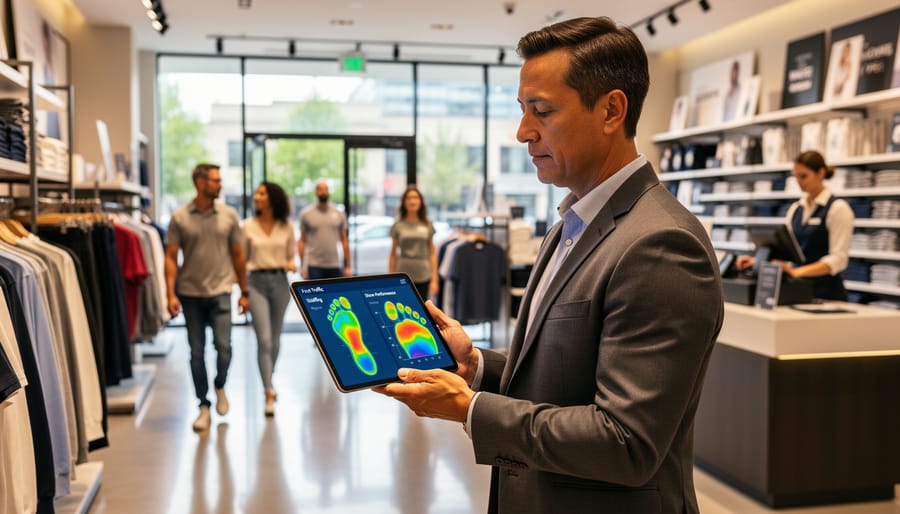
Some retailers even use heat mapping technology to understand which areas of their stores attract the most attention, helping them strategically place high-margin items and create inviting browsing spaces. This data-driven approach means every detail, from the music playlist to the champagne service timing, aligns perfectly with customer patterns.
The Distillery District Experience
The cobblestone streets of the Distillery District present a unique challenge for boutique retailers who serve two distinct customer bases. During summer weekends, tourists flood the pedestrian-only pathways, snapping photos and browsing leisurely. Meanwhile, local shoppers tend to visit on weekday evenings and off-season months, seeking that neighborhood gem experience without the crowds.
Smart retailers here track these patterns meticulously. A local ceramics shop discovered through foot traffic data that 70% of weekend visitors were tourists making impulse purchases, while Tuesday and Wednesday afternoons drew loyal locals willing to spend more per visit. This insight led them to adjust staffing levels and product displays accordingly—showcasing Instagram-worthy pieces near entrances on Saturdays, while reserving custom consultation appointments for quieter weekdays.
The data also reveals seasonal shifts. January through March sees the ratio flip dramatically toward local traffic, allowing shops to host community workshops and build deeper customer relationships. Understanding these rhythms helps Distillery District businesses maximize revenue year-round rather than relying solely on tourist season peaks.
Independent Shops on Queen and Ossington
Along Toronto’s shopping destinations, the independent shops lining Queen West and Ossington Avenue have mastered the art of reading their neighborhood rhythms. These retailers use foot traffic data to make smart decisions that help them compete with larger chains.
Take the vintage clothing boutiques on Queen Street West. By tracking pedestrian patterns, they’ve learned that Thursday evenings bring different shoppers than Saturday afternoons, allowing them to adjust staff schedules and plan pop-up events accordingly. One local bookstore owner discovered their peak traffic happens during weekday lunch hours, prompting them to introduce a coffee bar and quick-browse displays near the entrance.
On Ossington, coffee shops and galleries have formed an informal collective, sharing traffic insights to coordinate extended evening hours during summer months when foot traffic spikes. This data-driven collaboration helps everyone capture more business without overstretching resources during slower periods.
The lesson? Understanding your specific corner’s traffic patterns gives you an edge, helping you show up when your customers do.
What Smart Retailers Learn from Their Data
Staffing Smarter, Not Harder
Here’s the thing about staffing a retail store in Toronto: schedule too many people during slow hours, and you’re burning money; schedule too few during rush times, and you’re losing sales while frustrating customers. Foot traffic analytics takes the guesswork out of the equation. By tracking exactly when customers flood through your doors—whether that’s the lunch rush at Eaton Centre or Saturday afternoons in the Distillery District—you can align your team’s hours with actual demand. The result? Labor costs drop because you’re not overstaffing quiet periods, yet service improves because you have the right people on the floor when it matters most. Store managers across Toronto report cutting scheduling costs by up to 20 percent while simultaneously reducing customer wait times. It’s about working smarter with the data you have, not just throwing more hours at the problem.
Marketing That Actually Matches Reality
Here’s the truth about retail marketing: timing is everything. Those foot traffic analytics you’re collecting aren’t just numbers—they’re your roadmap to smarter spending. Instead of posting to Instagram at random times or running promotions when it feels right, let the data guide you. Notice foot traffic spikes between 11am and 2pm on Thursdays? That’s when your social media posts should go live. Seeing a predictable lull every Tuesday afternoon? Perfect time to test a flash sale and turn slow hours profitable. Toronto retailers using traffic patterns to schedule their marketing efforts report spending less while reaching more actual customers. It’s about showing up when people are actually walking by, not when you hope they might be.
Store Layout and Window Display Timing
Your window display might be stunning, but is anyone actually stopping to look at it? Toronto retailers are now using foot traffic analytics to answer that question with precision. Heat mapping technology tracks where customers pause, which displays capture attention, and how long shoppers engage before stepping inside. The data often surprises store owners—that elaborate corner display might be going unnoticed while a simple storefront element draws consistent crowds.
Smart retailers use this intelligence to time their refreshes strategically. Analytics reveal that displays lose effectiveness after about two to three weeks in high-traffic areas like Queen West or the Distillery District, as regular passersby become immune to familiar sights. The data also shows optimal refresh times—typically early weekday mornings when foot traffic is lighter, minimizing disruption while maximizing the impact on afternoon and weekend shoppers. This approach transforms window dressing from guesswork into a data-driven strategy that keeps your storefront perpetually fresh in the eyes of Toronto’s diverse street traffic.
Getting Started Without Overwhelming Your Budget
Questions to Ask Before You Buy
Before investing in foot traffic analytics for your Toronto retail space, ask yourself a few practical questions. First, what are your specific business goals? Whether you’re looking to optimize staffing during rush hour at Yonge-Dundas Square or understand seasonal patterns during Toronto’s unpredictable winters, clarity helps you choose the right solution. Consider your store size and layout—a compact Queen West boutique needs different tracking capabilities than a multi-floor Yorkdale location. Think about Toronto’s unique seasonal shifts, from summer patio culture to PATH system migration during cold months, and how these affect your customer flow. Budget matters too, so determine what analytics features align with your actual needs rather than paying for bells and whistles you won’t use. Finally, ask potential providers about their experience with Toronto retailers and whether they understand local market nuances like streetcar traffic patterns or neighborhood-specific shopping behaviors. The right questions now save you headaches later.
Local Providers Who Understand Toronto Retail
When you’re ready to invest in foot traffic analytics, partnering with a local provider offers distinct advantages. Toronto-based vendors understand the unique rhythms of our retail landscape—from navigating winter weather impacts on Queen Street foot traffic to measuring the tourist influx at Harbourfront during summer festivals. Local companies are familiar with provincial privacy regulations and municipal requirements that affect data collection in public spaces.
A provider with Toronto roots brings valuable context to your analytics. They know how subway closures shift pedestrian patterns, how neighbourhood festivals drive temporary traffic spikes, and which seasonal trends genuinely matter for your specific location. Look for vendors who can reference local success stories and demonstrate experience with Toronto retailers facing similar challenges to yours. They should offer flexible solutions that work whether you operate a single boutique in Leslieville or manage multiple locations across the GTA, and they’ll be accessible for in-person consultations when you need hands-on support.
What once seemed like sophisticated technology reserved for mega-retailers has quietly become one of the most democratic tools in Toronto’s retail landscape. Footfall analytics has transformed from an expensive luxury into an accessible resource that’s leveling the playing field for independent shops, neighborhood boutiques, and homegrown brands across our city.
From the bustling markets of Kensington to the trendy storefronts along Queen West, Toronto retailers are discovering that understanding their foot traffic isn’t about having the biggest budget—it’s about making smarter decisions with the resources you already have. The mom-and-pop cafe on College Street now has access to the same insights that helped major chains optimize their operations, and they’re using that data to compete and thrive in ways that were unimaginable just a few years ago.
This shift matters because Toronto’s retail identity has always been defined by its diversity and local character. When independent shops have the tools to understand their customers’ patterns, adjust their strategies based on real evidence, and prove their value to landlords and investors, the entire retail ecosystem becomes stronger and more resilient.
The message for Toronto’s retail community is clear: you don’t need to guess anymore. The data is accessible, the technology is affordable, and the competitive advantage is real. Your storefront, your neighborhood, your vision—now backed by insights that help you make decisions with confidence.